

Query Store 101
Today I heard a great analogy, and it inspired this post. Execution plans are like flight plans, there are multiple flight paths that can be taken to get from where you are to your ultimate destination. Some plans are more efficient than others, and we want to use those whenever possible. How can I make sure I am using the plan I want to use? Let’s talk about air traffic control, the Query Store.
What is the Query Store?
Starting in SQL Server 2016, Query Store is a native tool that tracks query execution data including execution statistics and execution plans. It provides graphical views in SSMS and dynamic management views to assist in identifying problem queries.
Reasons to give it a try?
- Knowing what queries are the most expensive
- Seeing all query executions and whether or not they have regressed based on code changes
- Ability to force specific plans for problem queries
Turning it on is a no brainer for many environments, but if your workload is mostly ad hoc you may not see the same benefit as environments that focus more on stored procedure execution
Getting Started
Installation
Since this is a database level setting and not a server level setting, you will have to perform these actions on each database to enable the Query Store. After the initial work to get this enabled, you do have the option to enable it on the model system database and every new database that gets created will also get this setting enabled so you don’t have to worry about doing it later. There are two ways to get Query Store enabled in your environment.
The fastest way to get this enabled on a long list of databases would be to use T-SQL or PowerShell. For PowerShell, I highly recommend utilizing dbatools.io. It’s free and full of amazing documentation.
ALTER DATABASE [StackOverflow2010] SET QUERY_STORE = ON;
ALTER DATABASE [StackOverflow2013] SET QUERY_STORE = ON; 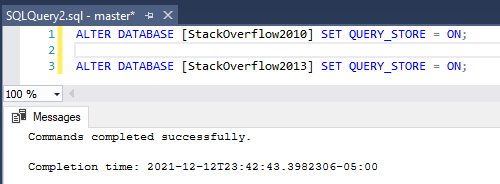
Set-DbaDbQueryStoreOption -SqlInstance ServerA -Database StackOverflow2010, StackOverflow2013 -State ReadWrite
You can also use the user interface to enable this feature. Right click the database and then open the properties. From here, change the operation mode from off to read write. We will go over additional settings to consider in the section below that can also be updated in this view.

Settings to Consider
To implement any of the below settings, you can use the UI like the screenshot above, dbatools for PowerShell, or T-SQL (which I will include below)
Max Size is exactly what it sounds like, a limit to how large you want your query store to grow. Most of the settings below will affect how much space is required, but a good default to work from would be 1GB, adjusting based on the below settings. If the query store runs out of space, it will go from read write to read only and stop gathering query metrics.
Data Flush Interval is used to control how often Query Store goes from memory and gets persisted to disk. When considering this setting, think about how much data you are willing to lose from query store if you have a DR situation arise.
Statistics Collection Interval decides how often to collect metrics. The more often you collect affects how much space you need, but also provides greater levels of granularity when looking into issues in the environment.
Stale Query Threshold controls how often to clean up old data and inactive queries. This setting directly impacts how much space is required for query store.
Query Store Capture Mode determines what queries are captured in query store. Typically this is set to All if you want to capture every query or to Auto if you are ok with SQL ignoring insignificant queries based on execution counts, compile and run times.
Well it’s on, now what?
Stay tuned for additional blogs in my Query Store series to cover basic built in reporting, using query store to assist in tuning, and more advanced features!

Tuning Basics – Updating an Update
You are out doing your scheduled sweeps of the environment and you notice a huge I/O consumer is one of your update procedures. Your initial thought may be to panic because how can you test data that is changing? You have several methods to tuning queries that adjust data that allow data to revert between tests.
NOTE: We always recommend tuning queries in non-production until we have our final tested solution to implement in production.
Tuning with Rollback Transaction
One of the more basic methods for executing queries without changing data is to wrap the statements are you running in a BEGIN TRANSACTION and ROLLBACK TRANSACTION. This allows everything to execute and give you the performance statistics you are looking for, while leaving the data intact to allow for repeat testing.

Tuning using Database Backups
You have a couple options with your standard SQL Server backups to assist in reverting changes made to the testing environment and the same concepts are applied to your basic DR strategy. If the test is short, you can take a full backup before making a change and restore that backup to restart a test.

If you are making a series of changes over a period of time and don’t want to completely restart your test, you can utilize point in time recovery. Once your database is in full recovery, you can start with a full backup and take log backups at set intervals or before different pieces of your change. This allows you to restore to a specific point in your test.

Tuning Database Snapshot
Database Snapshots are a great way to quickly revert large databases to an initial state. Database Snapshots keep a record of database pages as they change and the copy of the page so those extents can be reverted instead of restoring the whole database. Therefore, they require the associated source database as it is not a full copy of the database. Snapshots contain the original version of files of the source database and a pointer file that shows the changes since the snapshot was taken, called a sparse file. The source database must be available for snapshots to be usable. This makes them not an ideal DR solution, but great for analysis in auditing and in tuning situations.

Summary
There are many ways to quickly get back to your original state to allow for quick repetitive testing for queries that change data. A huge benefit of the methods I listed today allow you to also document where transactions and backups occur so you can open a .sql file and have all the needed steps in one document. Do you like other ways to revert changes? Maybe temporal tables? I’d be happy to cover that in a post in the near future. Tell me all about your methods in the comments below!

Clustered Index vs Heap
What is a heap?

Heap was actually named pretty accurately. It is a “pile” of unsorted/unorganized data. A heap will exist on any table that lacks a clustered index. Heaps can exist even if you have a non clustered indexes. The main advantage to a heap is the speed at which you can insert data into your tables, as it doesn’t need to follow a logical order like inserting identity values into the last page of a table.
What is a clustered index?

A clustered index is used as the main method of logically sorting data in a table. It can be done on a key value defined in the table, but it doesn’t require an actual primary key to exist. Clustered indexes should be created on the most common column(s) used in the predicates of your most frequently executed statements. All data will be sorted to match the index and you can only have 1 clustered index per table. The main advantage to having a clustered index is increased speed on data reads.
How should I identify when a clustered index should be used instead of a heap?
As noted above, the main advantage of a clustered index is an increase in the speed of your reads. To get an idea of where you might need to increase read speed, you should first identify all of your tables that do not have a clustered index. I found it very helpful to also place lower limits on the number of rows in a table and the number of reads against that table (by checking dynamic system views). The below query is a great start into looking at those things.
DECLARE @type_of_index INT = 0 /*0 = heap, 1 = clustered, 2 = non clustered*/
	, @min_num_of_reads INT = 10
	, @min_num_of_rows INT = 100

SELECT OBJECT_NAME(IX.OBJECT_ID) AS Table_Name
   ,SCH.name AS SchemaName
   ,IX.name AS Index_Name
   ,IX.type_desc AS Index_Type
   ,PS.row_count AS TableRowCount
   ,SUM(PS.[used_page_count]) * 8 IndexSizeKB
   ,IXUS.user_seeks AS NumOfSeeks
   ,IXUS.user_scans AS NumOfScans
   ,IXUS.user_seeks + user_scans AS NumOfReads
   ,IXUS.user_lookuPS AS NumOfLookuPS
   ,IXUS.user_updates AS NumOfUpdates
   ,IXUS.last_user_seek AS LastSeek
   ,IXUS.last_user_scan AS LastScan
   ,IXUS.last_user_lookup AS LastLookup
   ,IXUS.last_user_update AS LastUpdate
FROM sys.indexes IX
	INNER JOIN sys.objects O
		ON ix.object_id = O.object_id
	INNER JOIN sys.schemas SCH
		ON SCH.schema_id = O.schema_id
	INNER JOIN sys.dm_db_index_usage_stats IXUS
		ON IXUS.index_id = IX.index_id
		AND IXUS.OBJECT_ID = IX.OBJECT_ID
	INNER JOIN sys.dm_db_partition_stats PS
		ON PS.object_id = IX.object_id
		AND PS.index_id = IX.index_id
WHERE OBJECTPROPERTY(IX.OBJECT_ID,'IsUserTable') = 1
	AND IX.index_id = @type_of_index
	AND PS.index_id = @type_of_index
	AND IXUS.index_id = @type_of_index
	AND IXUS.database_id = (DB_ID())
	AND IXUS.user_scans + IXUS.user_seeks > @min_num_of_reads
	AND PS.row_count > @min_num_of_rows
GROUP BY OBJECT_NAME(IX.OBJECT_ID), IX.name, IX.type_desc, IXUS.user_seeks, IXUS.user_scans, IXUS.user_lookuPS, IXUS.user_updates, last_user_seek, IXUS.last_user_scan, IXUS.last_user_lookup, IXUS.last_user_update, SCH.name, PS.row_count
ORDER BY TableRowCount DESC, NumOfReads DESC
Now that you see what tables are on the larger side that also have a lot of reads, we can dive deeper into the MSSQL system dynamic management views to see how these tables are being used in the system by looking at query stats and plans. Enter your table name in the variable and you can see the number of times a plan has been used, the text associated to that plan, and the plan itself to validate if the query is using a table scan due to the heap or if there is a non clustered index that is being used instead. The 2nd result set will give you object names if the table is being used in a SQL object like a stored procedure or function
DECLARE @TableName NVARCHAR(50) = 'ExampleTableName'

SELECT TOP 10 databases.name AS DBName
	, dm_exec_sql_text.text AS TSQL_Text,
	, dm_exec_query_stats.creation_time,
	, dm_exec_query_stats.execution_count,
	, dm_exec_query_stats.total_worker_time AS total_cpu_time,
	, dm_exec_query_stats.total_elapsed_time,
	, dm_exec_query_stats.total_logical_reads,
	, dm_exec_query_stats.total_physical_reads,
	, dm_exec_query_plan.query_plan
FROM sys.dm_exec_query_stats
	CROSS APPLY sys.dm_exec_sql_text(dm_exec_query_stats.plan_handle)
	CROSS APPLY sys.dm_exec_query_plan(dm_exec_query_stats.plan_handle)
	INNER JOIN sys.databases
		ON dm_exec_sql_text.dbid = databases.database_id
WHERE dm_exec_sql_text.text LIKE '%'+@TableName+'%'
ORDER BY ;

SELECT *
FROM sys.sql_modules M
	INNER JOIN sys.objects O
		ON M.object_id = O.object_id
WHERE M.definition LIKE '%'+@TableName+'%'
After reviewing use cases and their query plans, it’s time to decide if the table in question meets the above recommendations for a clustered index or if it’s better served as a heap, and what columns to include in the index. If the table has multiple use cases but they all typically share the same column/s, create the clustered index on that table with those column/s.
Now don’t go throwing clustered indexes around like Oprah to the studio audience
The clustered index is helpful in a lot of situations, but there are some instances where it is not necessary or can actually do some harm to your performance.
The main example of this would be logging tables. These tables typically have a lot of insert operations, but not necessarily a lot of reads or even updates as they are just logging everything that is happening and are referenced infrequently. Putting an index on a table like that could cause hot latches which are caused by data waiting to be inserted into the last available page as the key is typically sequential and other data is frequently being inserted into that page. The only exception to this rule would be if your key column of the index is a GUID, as the GUID random and not sequential.
Watch out for making your clustered index on columns/data that is typically not static, meaning you would update these key values frequently. Updating key values on an index will likely cause performance issues. The clustered index is being used as a lookup point for all non clustered indexes and by updating the key values, you can cause page splits which will require index maintenance to fix your problem and return performance to where it belongs.
Another example of common mistake is making the clustered index too specific with too many columns included in the index. A clustered index is defining your default sort of all data in the table. Too many columns in an index could further slow down data operations by requiring resorting for additional use cases and it will also increase the size of all non clustered indexes on that table as well (and there is a limit to how wide a key can be for an index).
Finally, never forget the most important part of adding indexes: TEST TEST and TEST.
Post a comment below if you have any other tips or tricks when it comes to fixing your heap woes below!
